Solana price is still trading in a narrow band above the $120–$130 support area. The market has held this range for several sessions, and analysts are watching to see whether the next move will break the pattern or extend the pause that followed its broader 2025 pullback.
After falling from its 2025 highs, SOL slipped into a tight structure that has barely changed.
Traders now want to know if this zone will become a base for recovery or if it’s simply another stretch of sideways movement inside a larger correction.
The recent drop brought the price back into the $125–$130 region. Instead of breaking lower, this area has acted as a balance point.
SOL isn’t testing the deeper end of its support anymore, but it isn’t abandoning it either.
The chart still signals consolidation, not a clear shift in trend.
DISCOVER: Top Solana Meme Coins to Buy in 2025
Is Solana Stuck in a Neutral Compression Phase as Key $125–$145 Levels Decide the Next Move?
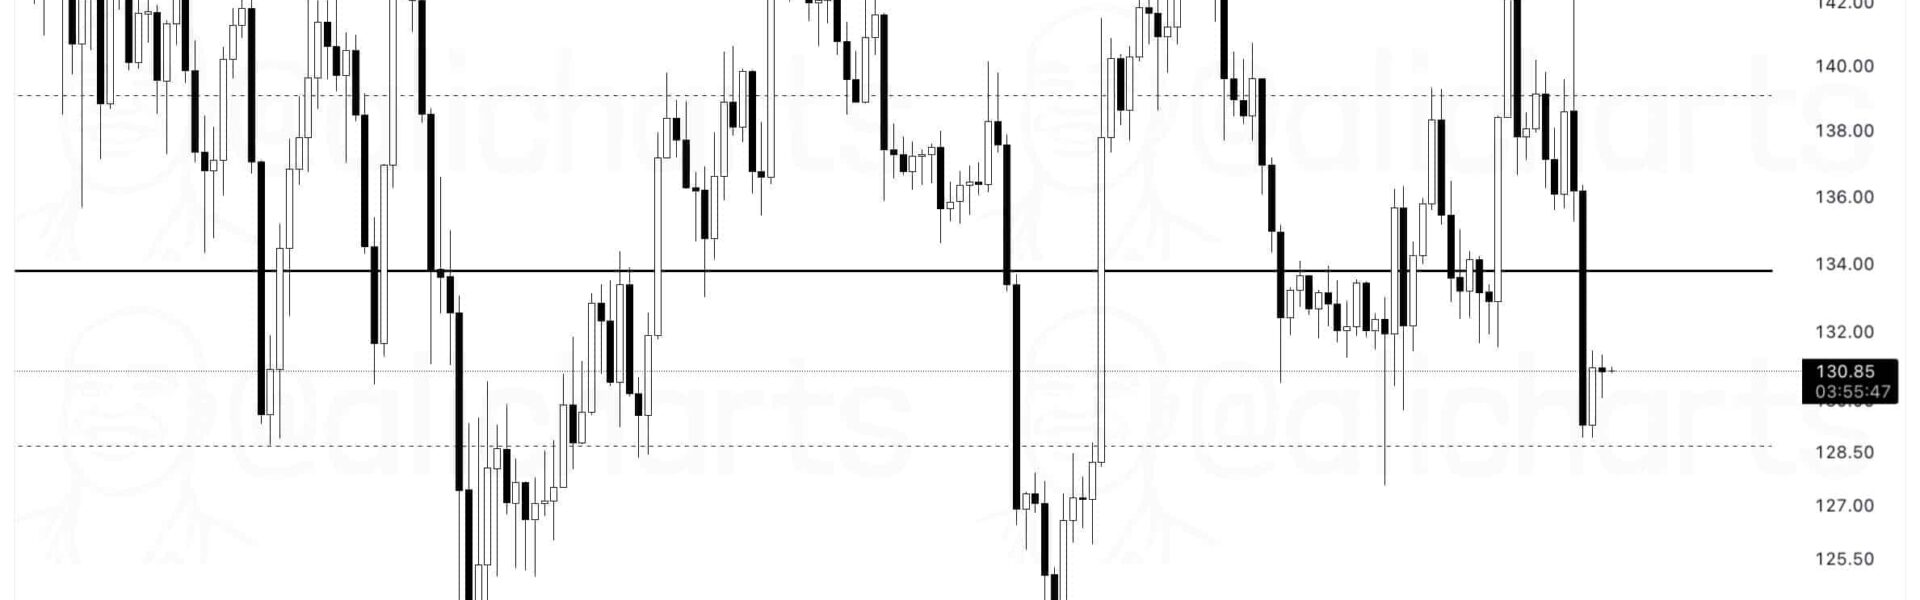
A chart shared by analyst Ali Martinez highlights the key levels nearby.
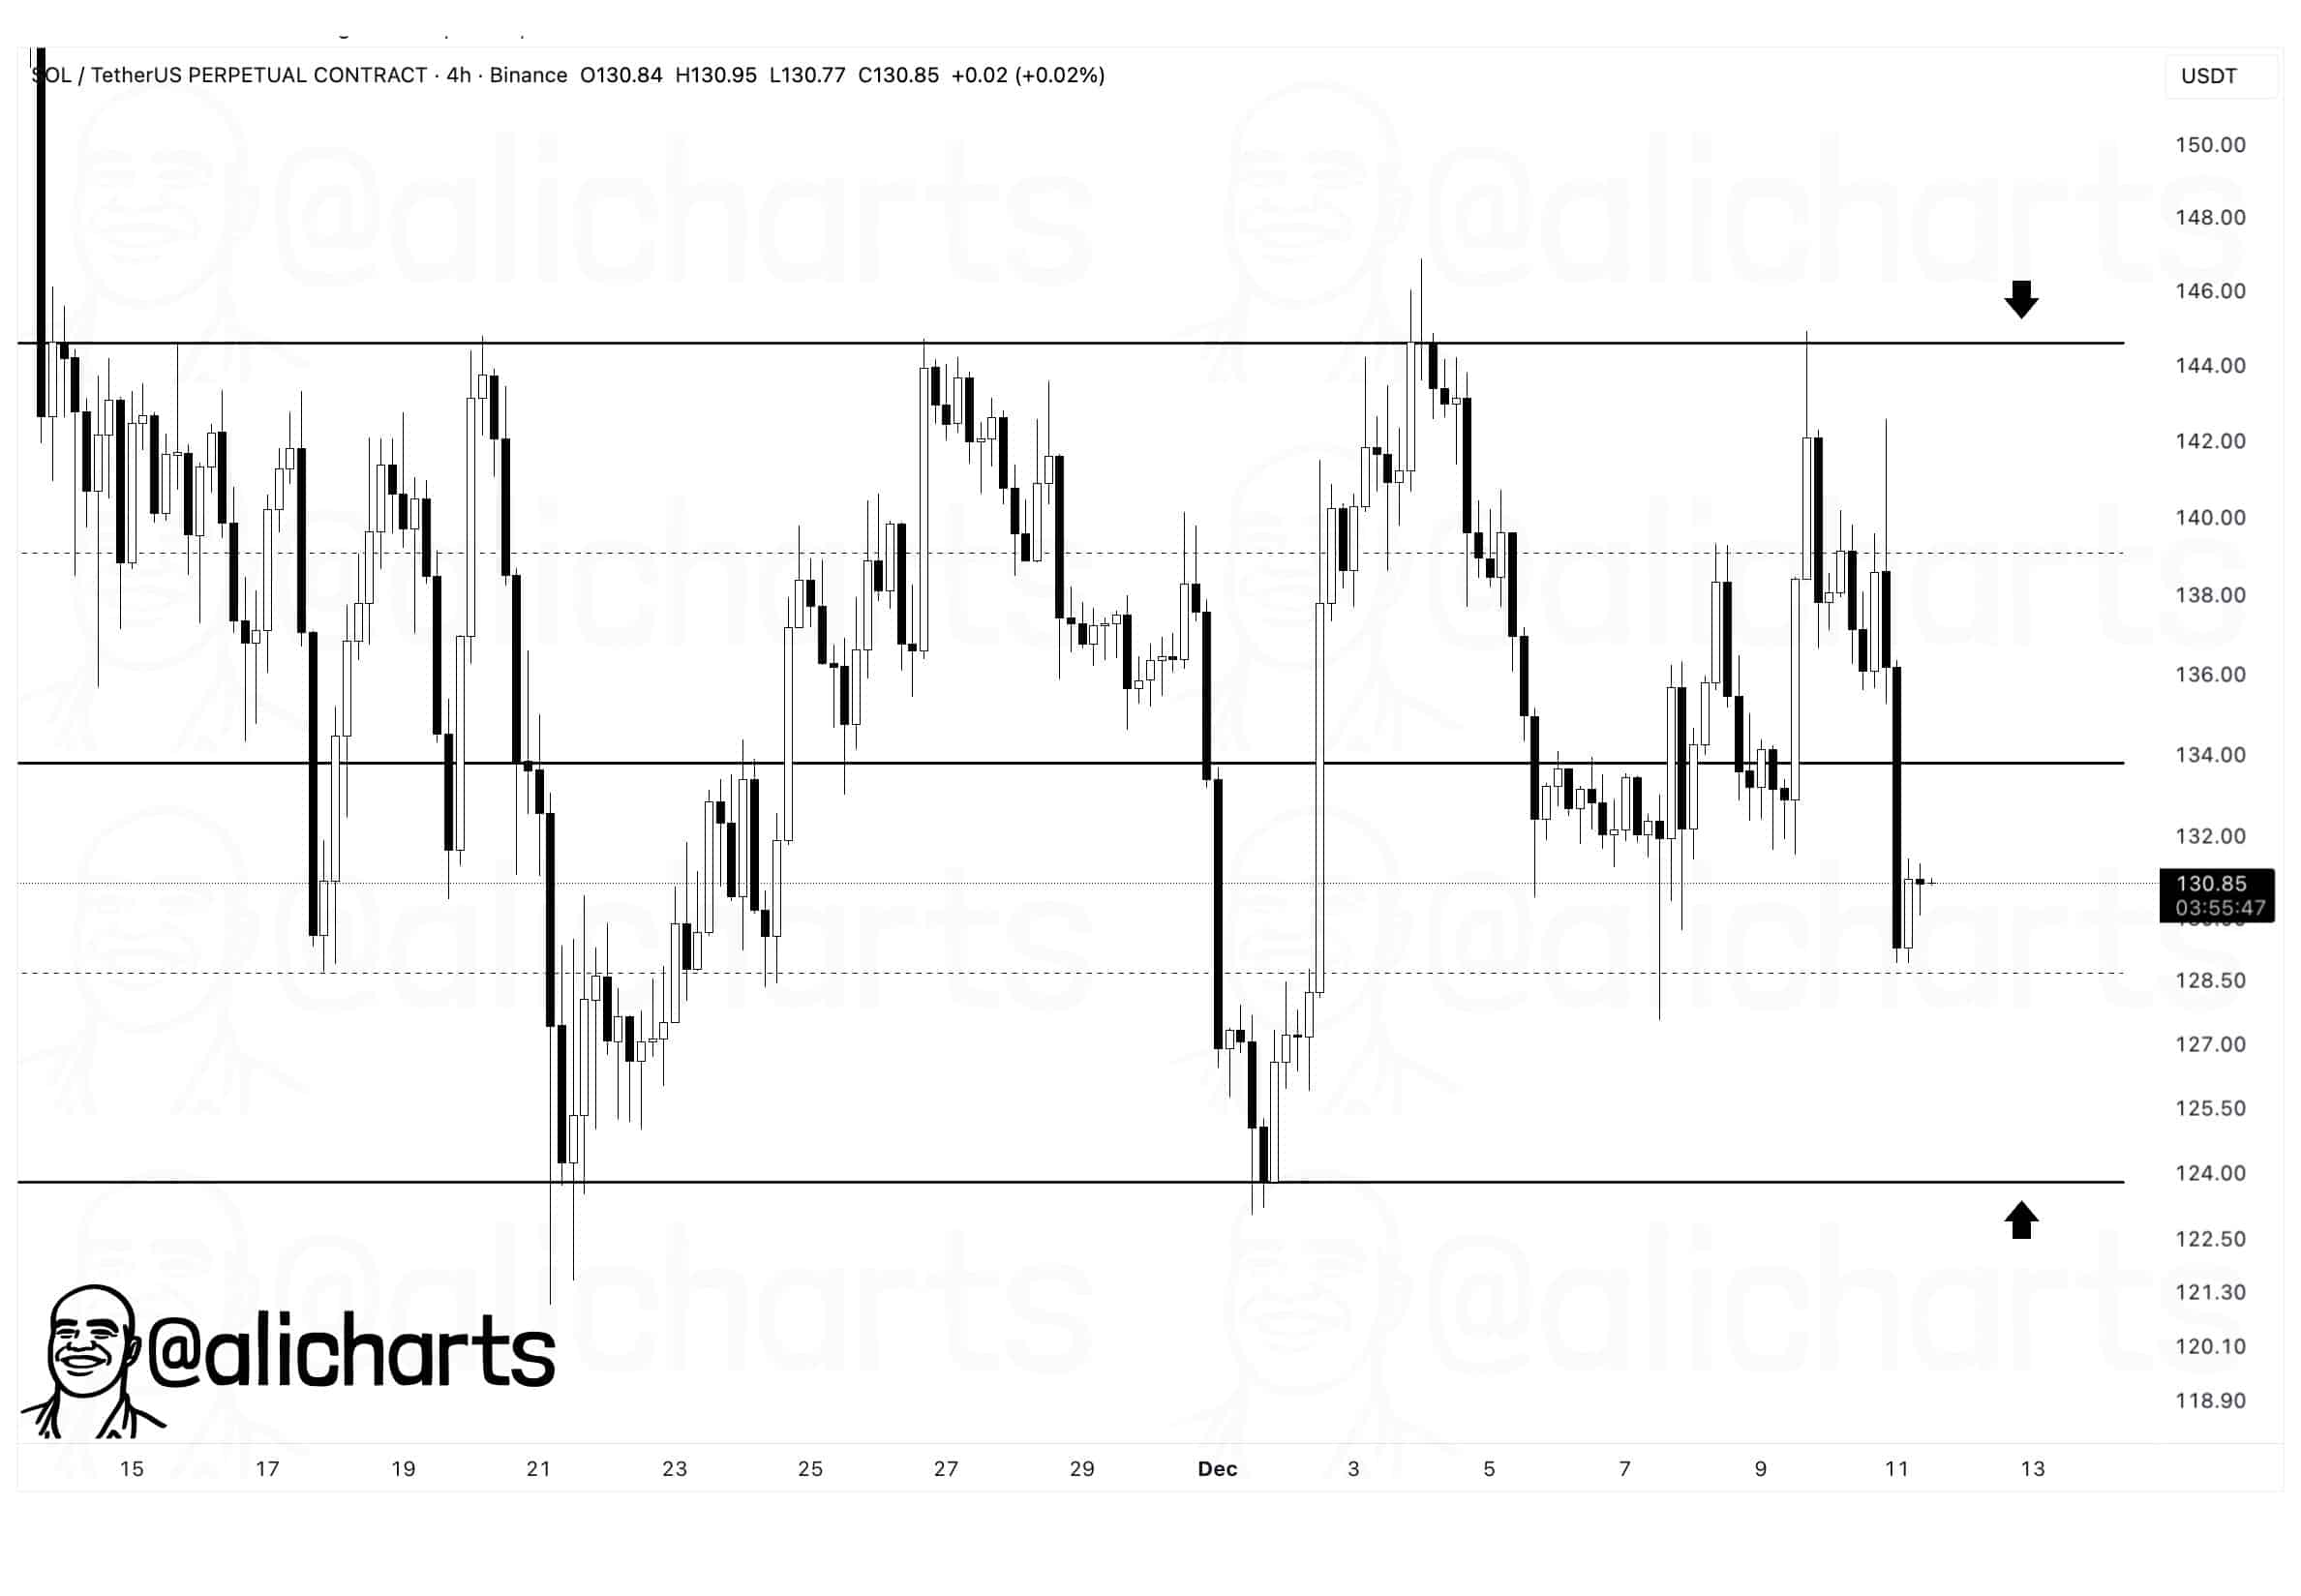
He said a move above $145 would turn the trend bullish, while a slip under $125 would signal fresh downside pressure.
Martinez called the current structure a “neutral compression phase,” suggesting SOL is waiting for direction as the market looks for a decisive signal.
From a chart-structure view, Solana is showing early signs of a possible reversal. Bitcoinsensus highlighted a falling wedge breakout on the daily chart.
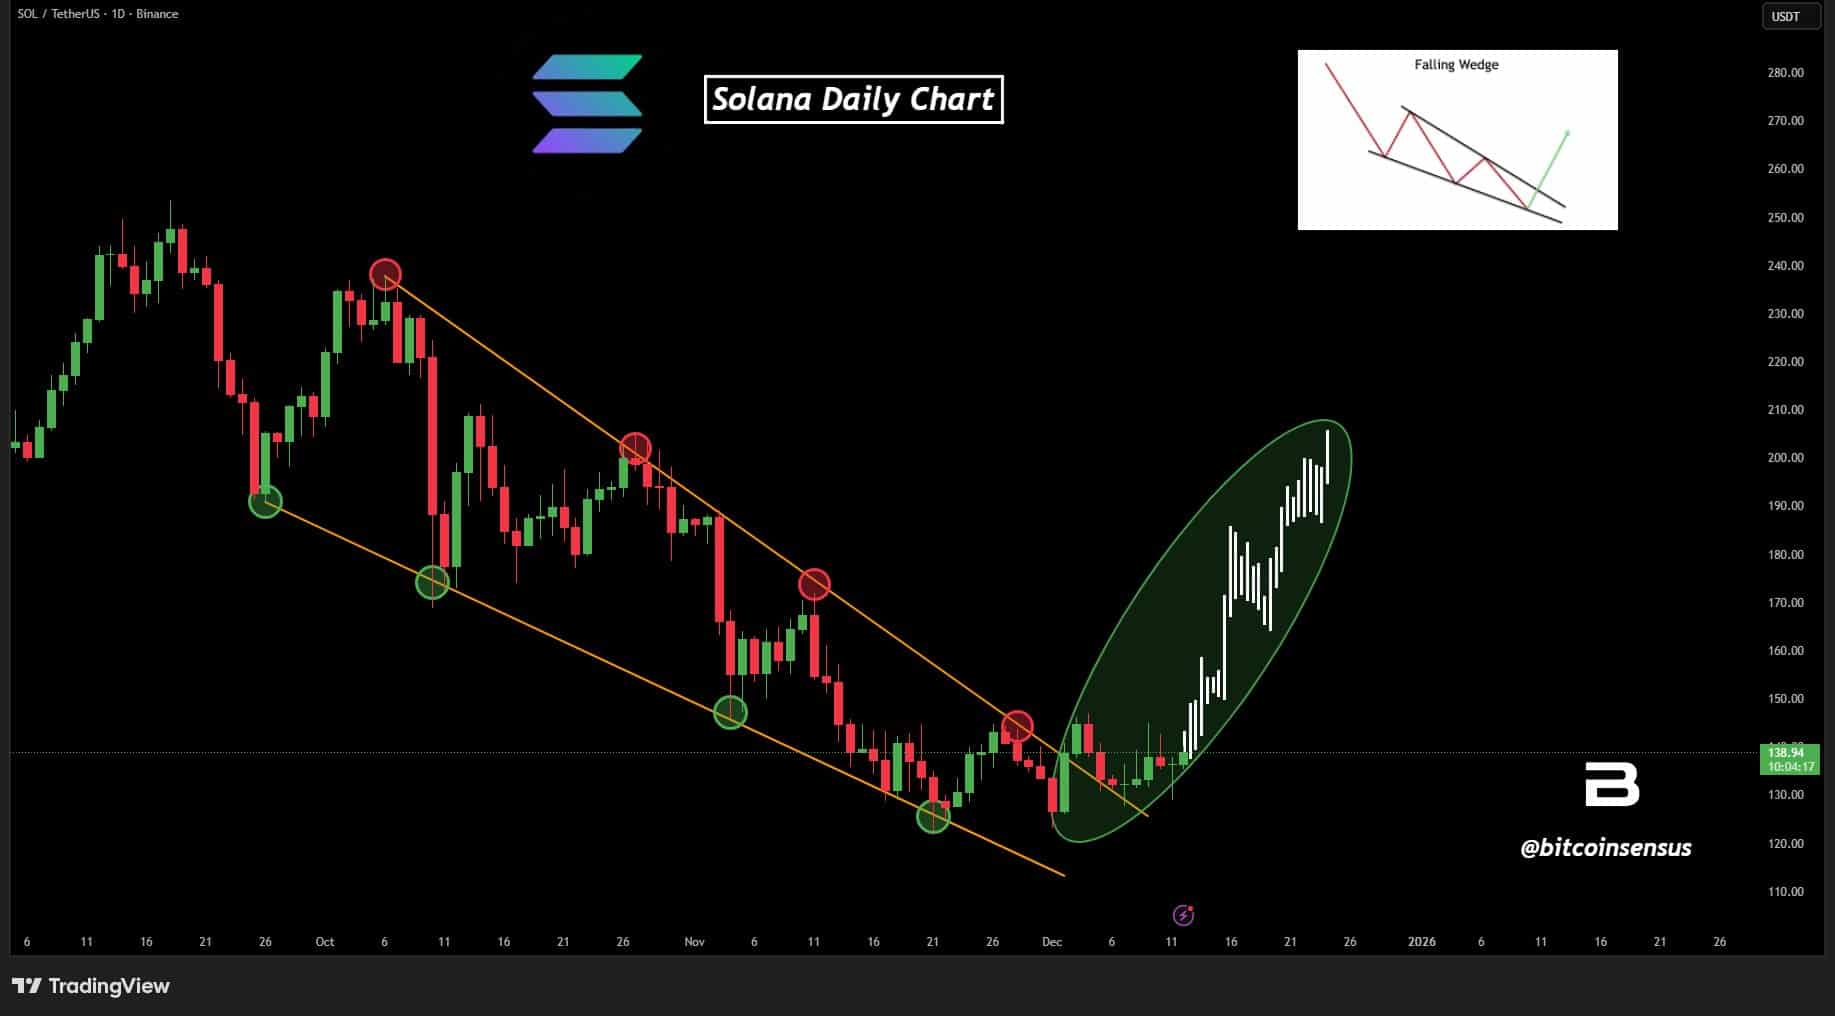
The move has played out on paper, but momentum hasn’t followed through.
SOL has yet to close above $140, which keeps the setup in a cautious zone rather than confirming a clean trend shift.
A broader look from CryptoGerla focuses on long-term support and resistance instead of short bursts of momentum. His chart marks the $120–$125 region as a major demand area.
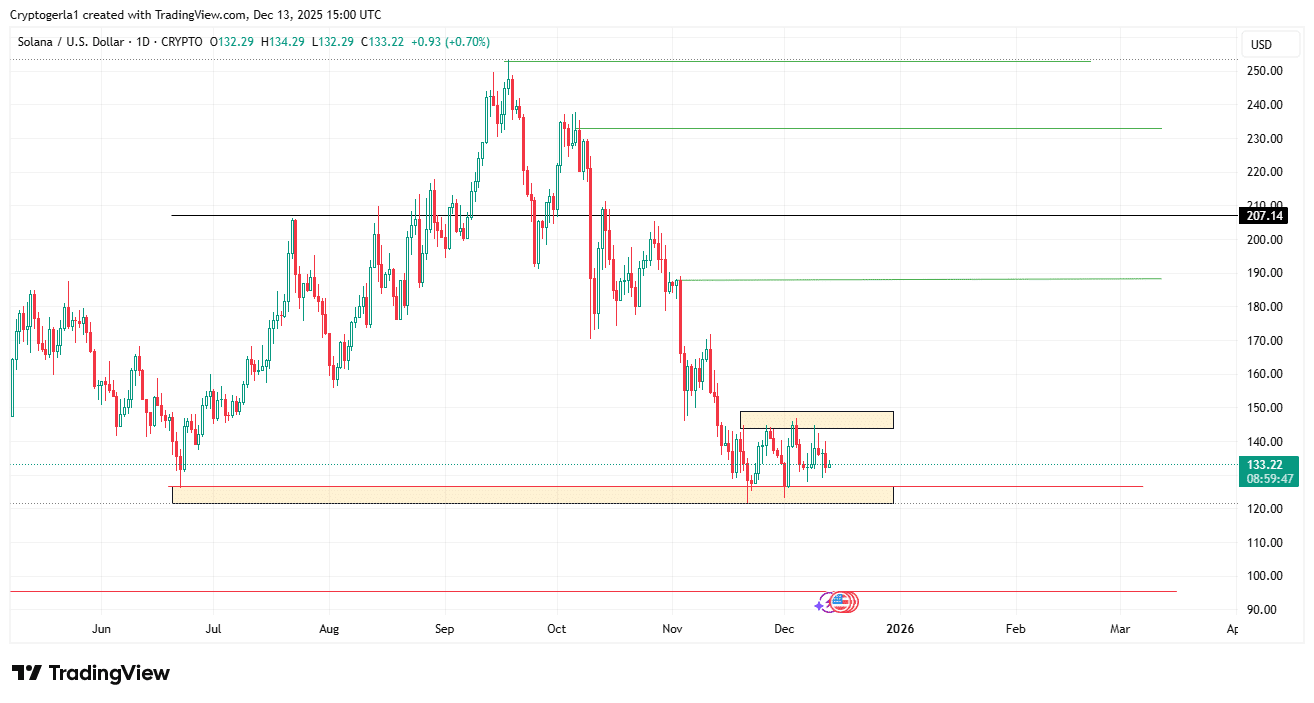
It has absorbed repeated waves of selling since the sharp drop from $200.
On the other hand, resistance remains thick between $150 and $185, where earlier rallies have encountered steady supply.
DISCOVER: 9+ Best High-Risk, High-Reward Crypto to Buy in 2025
What Does Solana’s Rising Support and Descending Resistance Signal Next?
A separate chart from DonOfCharts shows SOL tightening again after months of correction. The structure suggests a breakout window may be close.
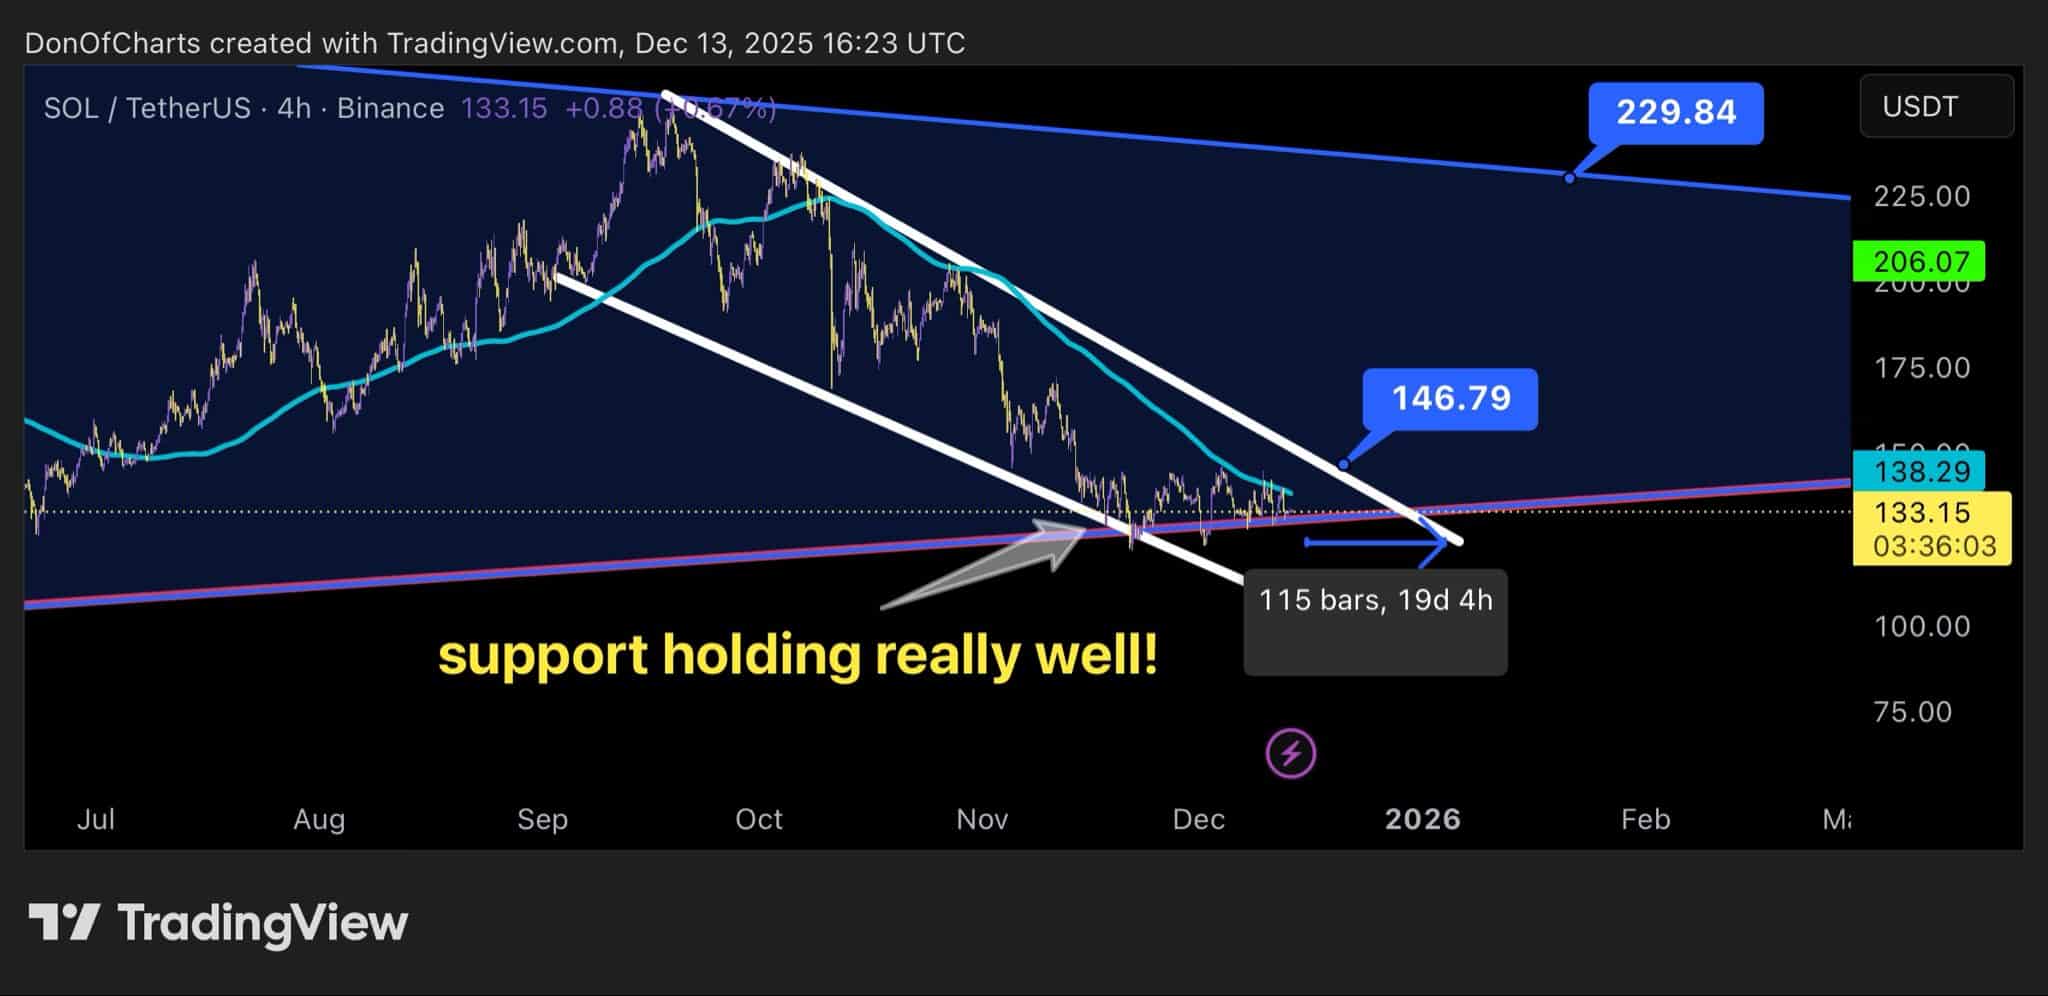
On the 4-hour chart, the token continues to hold a rising diagonal support that has been in place since mid-November.
Every pullback into this trendline has drawn buyers back in, a sign that downside pressure is losing strength.
At the same time, price is still held down by a descending trendline drawn from the September highs. This has created a tighter range and a clear compression zone.
The structure resembles a falling wedge, a pattern that often precedes a surge in volatility after a prolonged period of quiet trading.
The moving average on the chart has flattened and begun to curl upward, which supports the idea that selling pressure is losing strength.
Don drew attention to the timing of the setup, saying, “I am expecting a breakout before the 27th of December for $SOL.” With SOL now coiling near key support, traders are watching for a clean move that confirms where the market wants to go next.
DISCOVER: 10+ Next Crypto to 100X In 2025
The post Is SOL USD Preparing for a Breakout as Solana Price Holds Above Key Support? appeared first on 99Bitcoins.