Bitcoin remains trapped below key higher-timeframe resistance despite managing to stabilize above an important support region. While the broader trend is still bearish, the latest recovery attempt is accompanied by a notable uptick in the Exchange Whale Ratio, suggesting larger players are becoming increasingly active.
Bitcoin Price Analysis: The Daily Chart
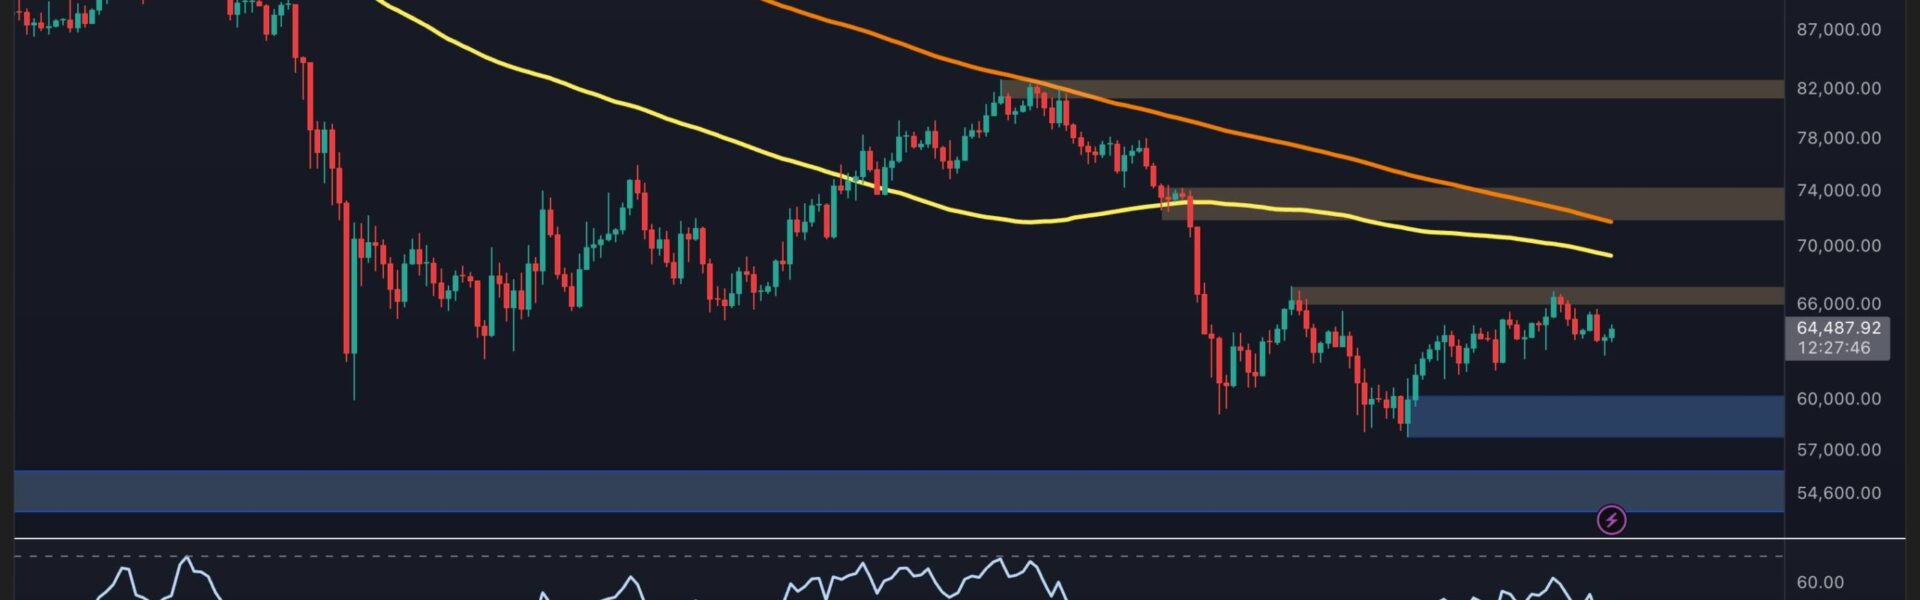
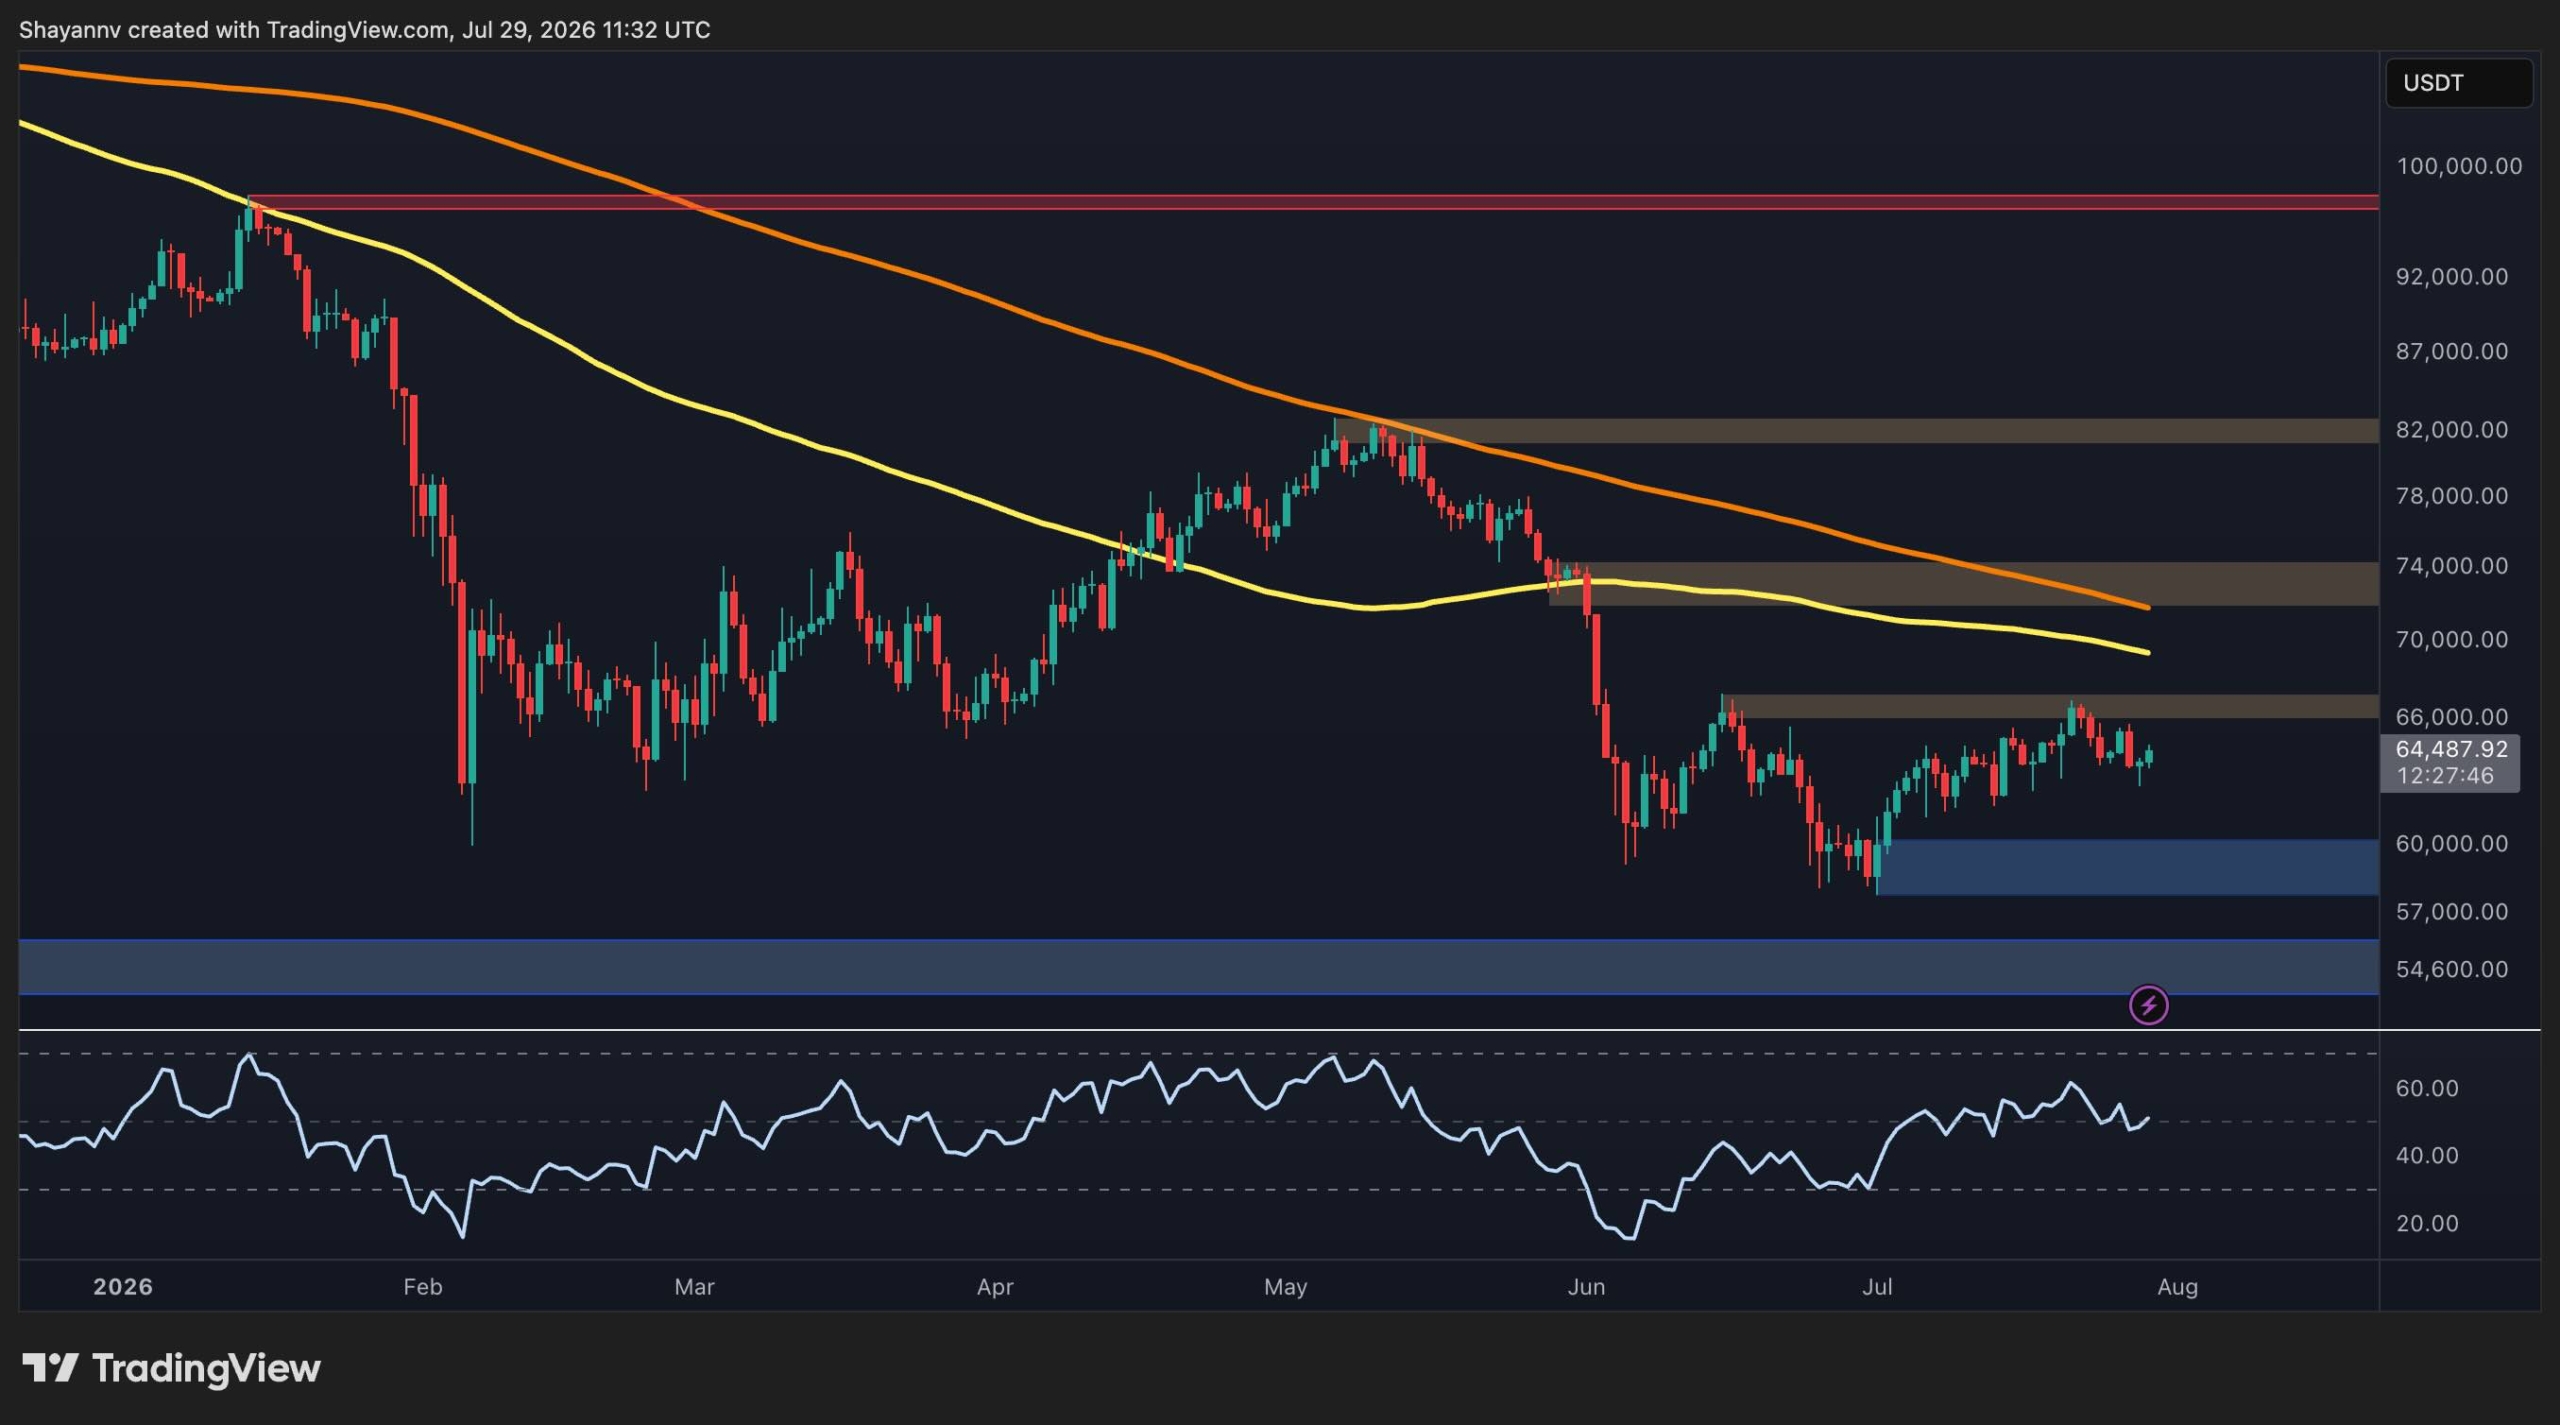
On the daily timeframe, BTC continues to trade below both the 100-day and 200-day moving averages, which are positioned around the $68K and $72K regions, respectively. The bearish alignment of these moving averages confirms that sellers still control the broader trend.
Following the sharp breakdown in early June, Bitcoin has entered a prolonged consolidation phase between the $58K support area and the $66K resistance zone. The price is currently hovering around $64K after several failed attempts to reclaim the overhead supply near $66K.
The $66K level represents the first major resistance, while a stronger barrier lies around $74K, just above the 100-day and 200-day moving averages. A sustained breakout above these levels would improve the medium-term outlook and could expose the $82K resistance area.
On the downside, buyers will likely defend the blue demand zone around $60K if the market visits it in the coming weeks. Below that, the next major support sits near $54K. As long as BTC remains above the $60K level, the current consolidation structure remains intact, although the inability to reclaim $66K keeps the broader bias cautious.
BTC/USDT 4-Hour Chart
The 4-hour chart shows Bitcoin rebounding after sweeping liquidity below the $63K support zone. Buyers stepped in aggressively following that move, pushing price back above the level.
The price is now attempting to reclaim the former ascending channel after breaking below its lower boundary. While this recovery is constructive, BTC still faces immediate resistance between $65K and $66K, highlighted by the nearby supply zone.
A successful breakout above this resistance could trigger another attempt toward the upper boundary of the broader range around $67K. However, repeated rejection from this area would reinforce the ongoing sideways structure and increase the probability of another revisit to the $63K support level.
Momentum has also improved modestly, with RSI climbing back around the 50 mark, but buyers still need stronger follow-through to shift short-term market structure decisively in their favor.

On-Chain Analysis
The Exchange Whale Ratio EMA has started climbing sharply after spending several weeks at relatively subdued levels. This metric measures the proportion of the largest exchange inflows relative to total inflows, with higher readings generally indicating that larger holders are becoming more active.
Historically, rising whale activity often precedes periods of elevated volatility, particularly when price approaches important technical levels. The latest increase coincides with Bitcoin’s struggle below major resistance, suggesting that large market participants may be positioning around this consolidation phase.
If the Exchange Whale Ratio continues rising while BTC remains below $66K, the risk of renewed distribution and another leg lower could increase. Conversely, a successful breakout above resistance despite elevated whale activity would indicate that demand is absorbing larger sell-side flows, potentially paving the way for a stronger recovery toward the higher resistance zones.

LIMITED OFFER for CryptoPotato readers at Bybit: Use this link to register and open a $500 FREE position on any coin!
Disclaimer: Information found on CryptoPotato is those of writers quoted. It does not represent the opinions of CryptoPotato on whether to buy, sell, or hold any investments. You are advised to conduct your own research before making any investment decisions. Use provided information at your own risk. See Disclaimer for more information.