
Key Takeaways
- Peter Brandt cited past bitcoin corrections of 75% or more after bull runs.
- Glassnode measured historical declines of roughly 75% to 93%.
- Bitcoin rebounded above $60,000 after falling to about $55,300.
Brandt Questions Whether Bitcoin’s Past Corrections Are Repeating
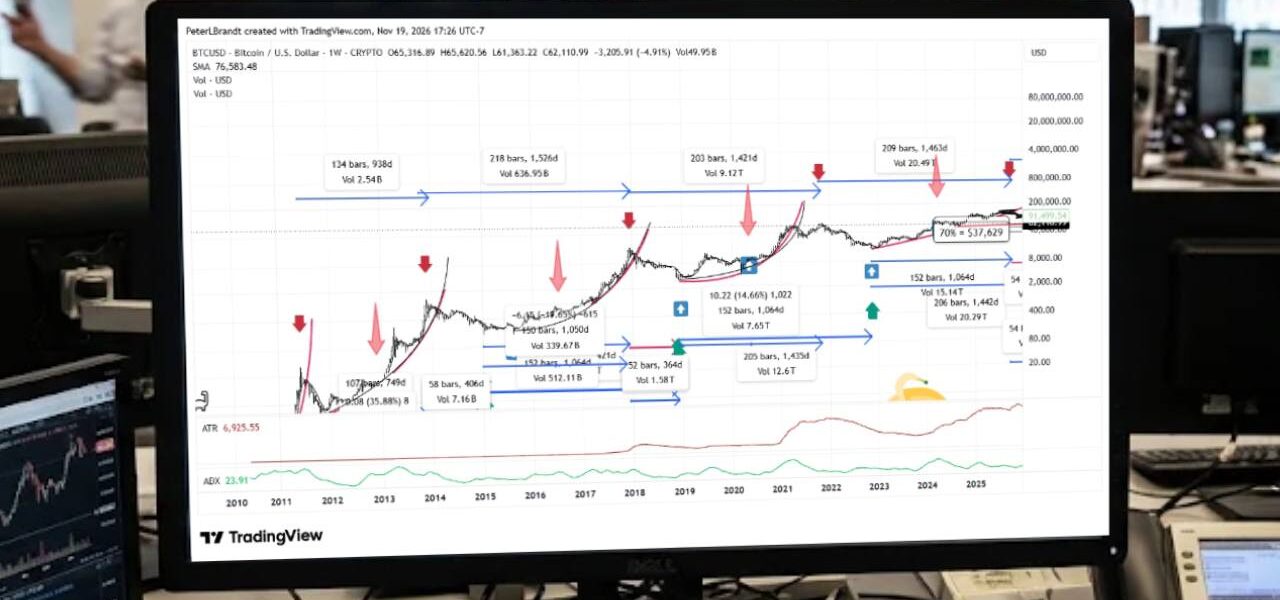
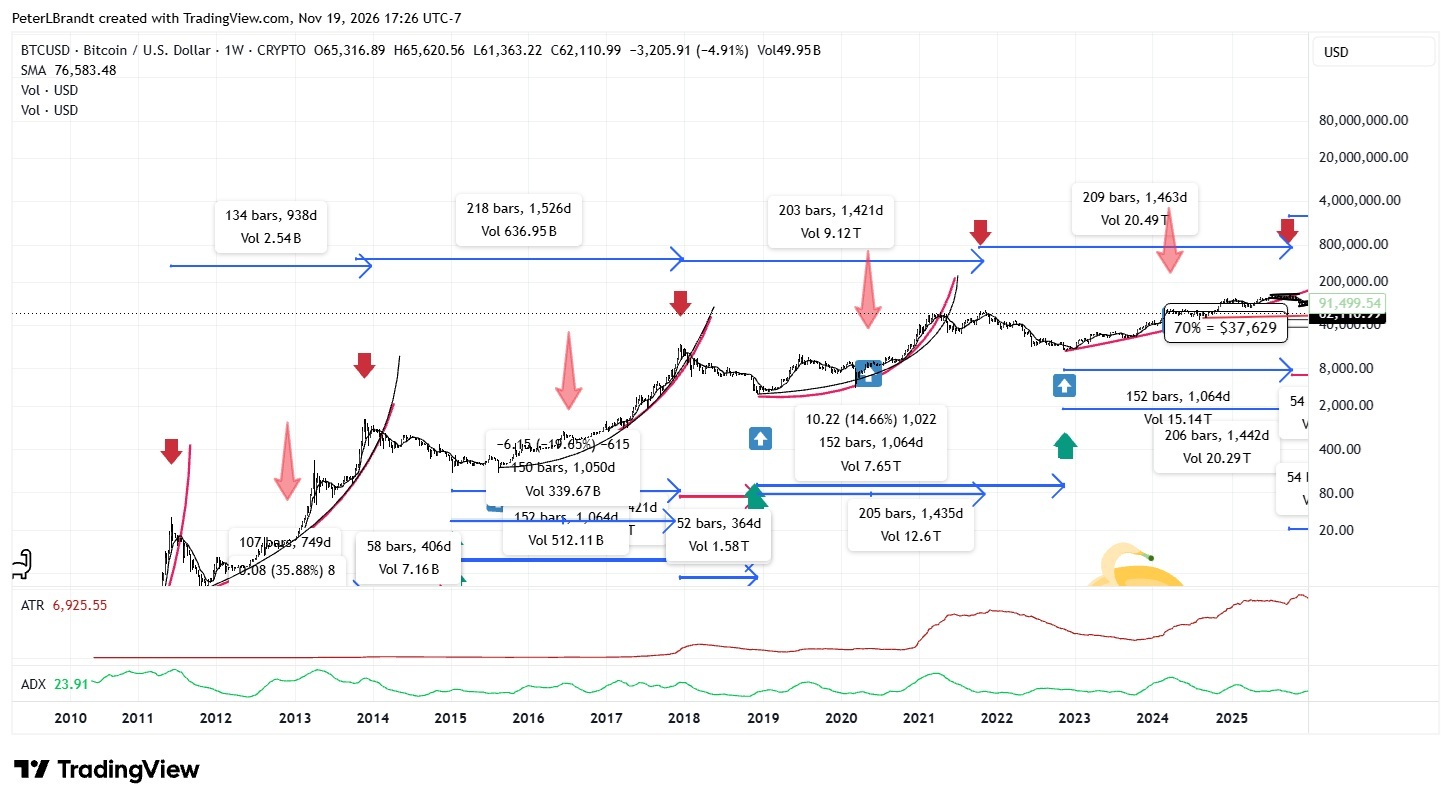
Veteran futures trader Peter Brandt of The Factor Report compared bitcoin’s sell-off with past corrections on Nov. 19. A chart he shared alongside his assessment traced several cycles of accelerating gains and sharp reversals. The comparison put the depth of the current decline in focus.
Brandt wrote:
“Every bull market phase in BTC’s history has ended with at least a 75% correction of the previous parabolic bull trend. Could this be what’s happening in bitcoin?”
In his June 2024 analysis of past bull cycles, Brandt measured the start of each new cycle from the low that followed a decline of at least 75%. He found that the time from those lows to the next halving was nearly the same as the time from the halving to the subsequent peak.
In July, Brandt put his projected bitcoin bottom range at $40,000 to $50,000, with a low expected in early October. At the time, he argued that bitcoin had matured enough to avoid the 80% or greater declines he associated with its earlier major bear markets.
How Bitcoin’s Decline Compares With Earlier Cycles
Bitcoin’s peak-to-trough decline in 2022 reached about 77%. The price went from $68,789 in November 2021 to $15,479 a year later. That percentage measures the full drop from the prior high to the subsequent low.
Glassnode’s comparison of historical cycle peaks puts past bear-market losses at roughly 75% to 93%. More recent completed cycles saw shallower declines in its series. The firm cautions that the sample is small and the choice of peak affects the comparison, especially for cycles with two peaks.
The price comparison across halving cycles shows another difference. At 940 days after the April 2024 halving, bitcoin was close to its price on the day of that reduction in mining rewards. At the same point after each of the previous three halvings, it was higher.
Brandt Flags a Bitcoin Level at $57,803
In another message on Nov. 19, Brandt wrote:
“I think I have BTC figured out. We are still in a major market. But we are heading lower first.”
Brandt shared a weekly chart on Nov. 20 that marked $57,803. The horizontal line extended from an earlier low to the latest bar on the chart. He wrote: “The territory below this level gets very dicey $BTC”
Bitcoin’s slide and subsequent rebound took it below Brandt’s level early on Nov. 21. It fell to about $55,300, roughly 56% below the October 2025 record of $126,080. By midmorning Eastern time, bitcoin had climbed back above $60,000.